Statistics are useful for Athletes, Coaches and Event Organisers. We have worked hard to analyse competitions and provide useful exports.
Engage the athletes and spectators with social media exports.
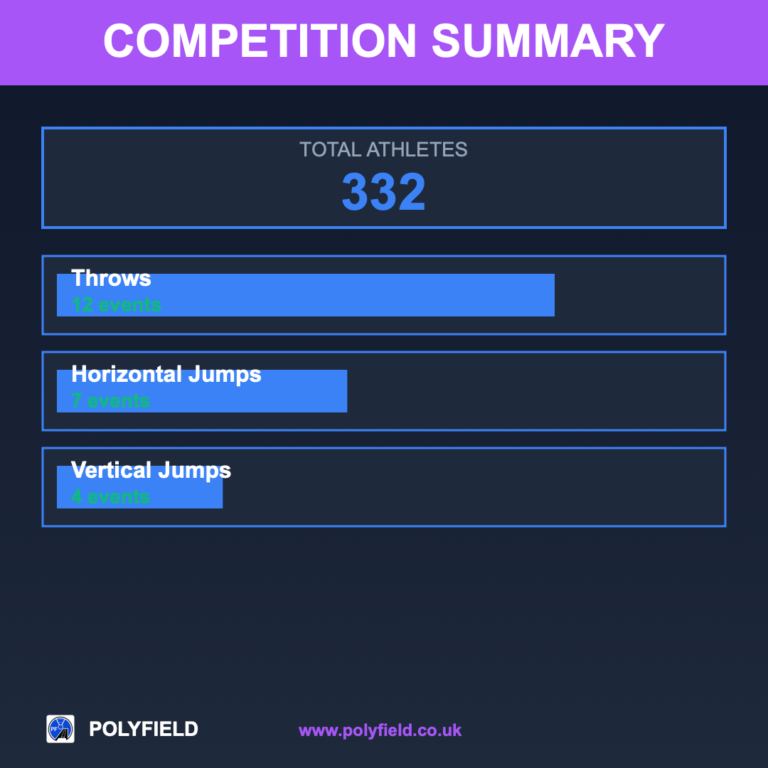
Inform future event planning with detailed competition metrics and performance over time reports.
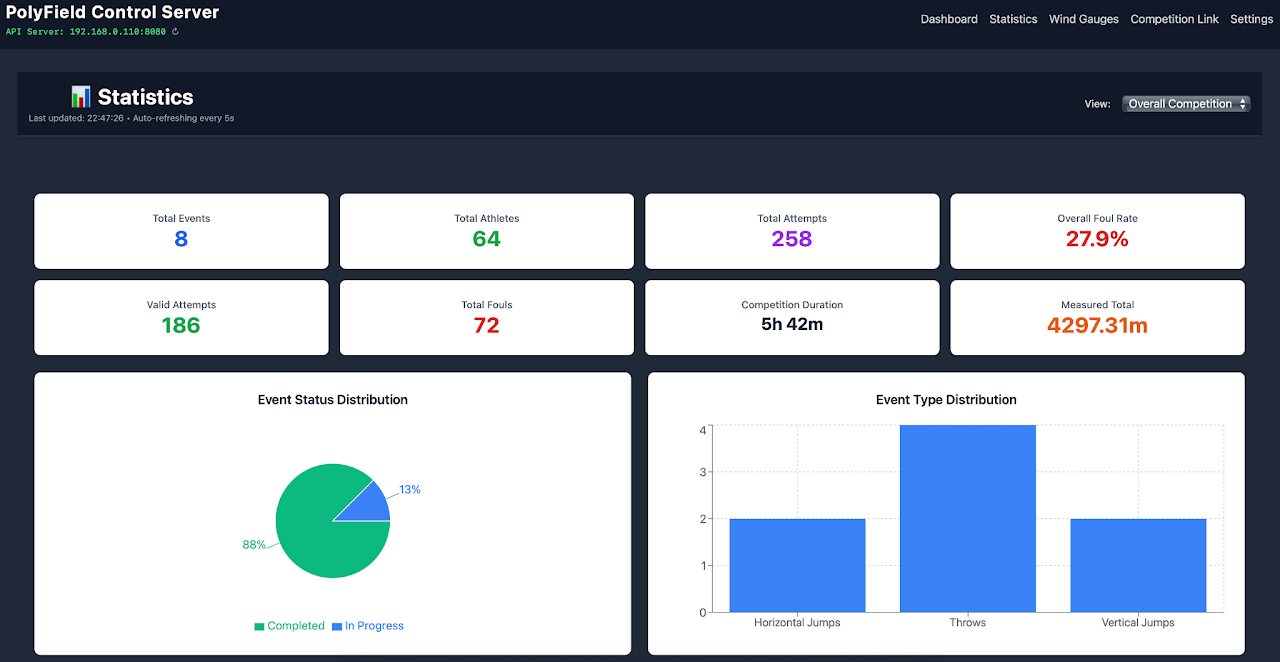
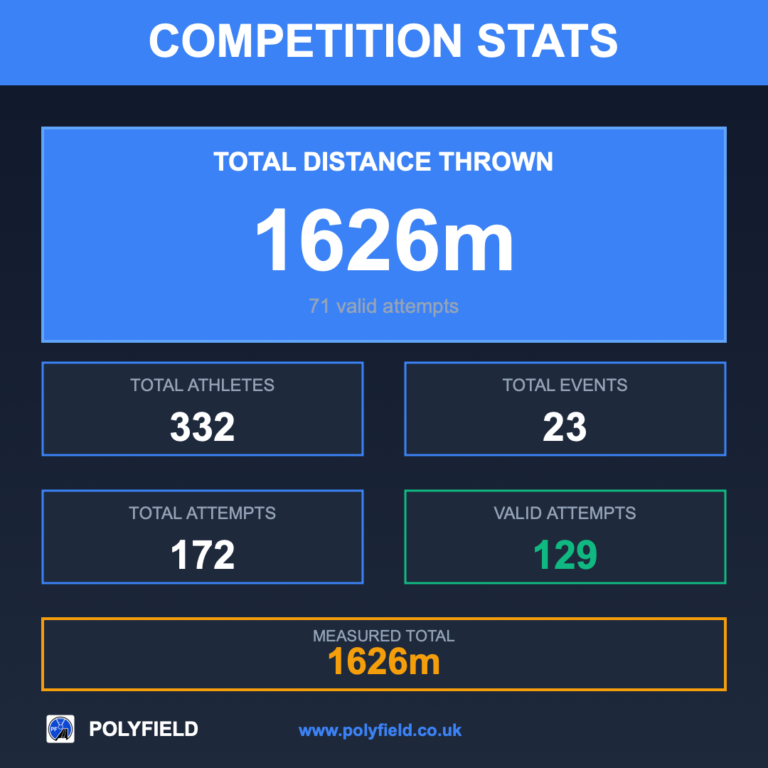
Whole Competition Metrics
Total Number of Events
Total Athletes Competing
Total Attempts (Jumps and Throws)
Overall Foul Rate (%)
Total Valid Attempts
Total Foul Attempts
Competition Duration
Measured Total (Distance and Height)
Event Durations
Duration of each individual event from start to end. This aids in the planning of future competitions and timetabling. Combine it with the number of athletes in each event for a richer data metric.
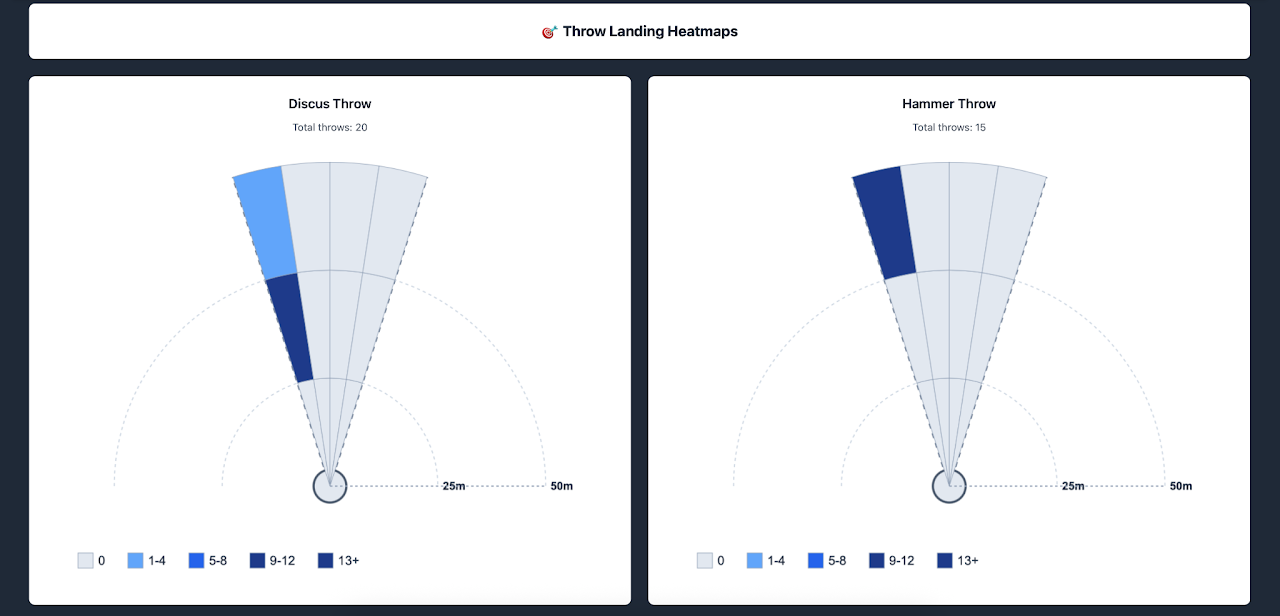
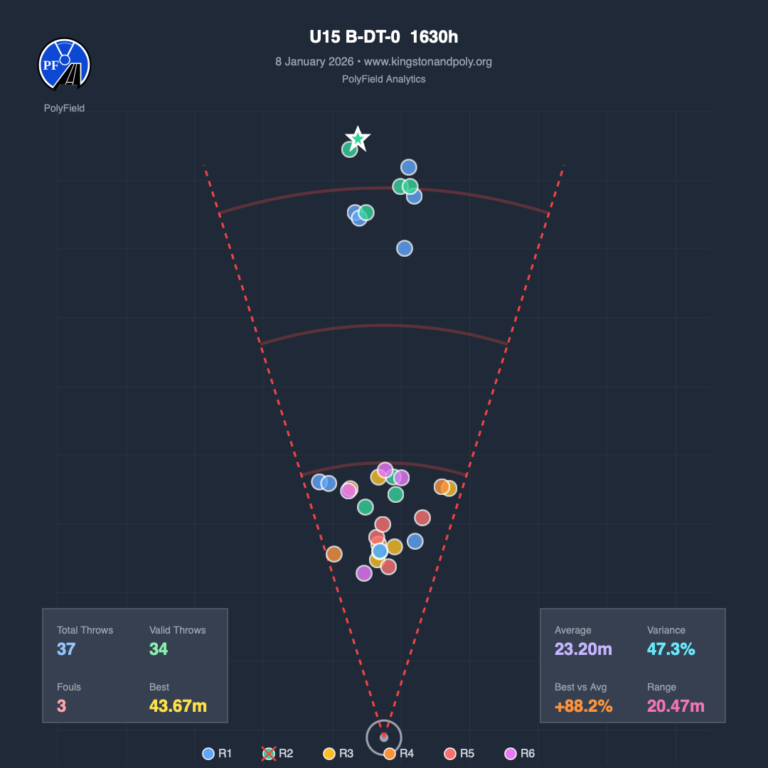
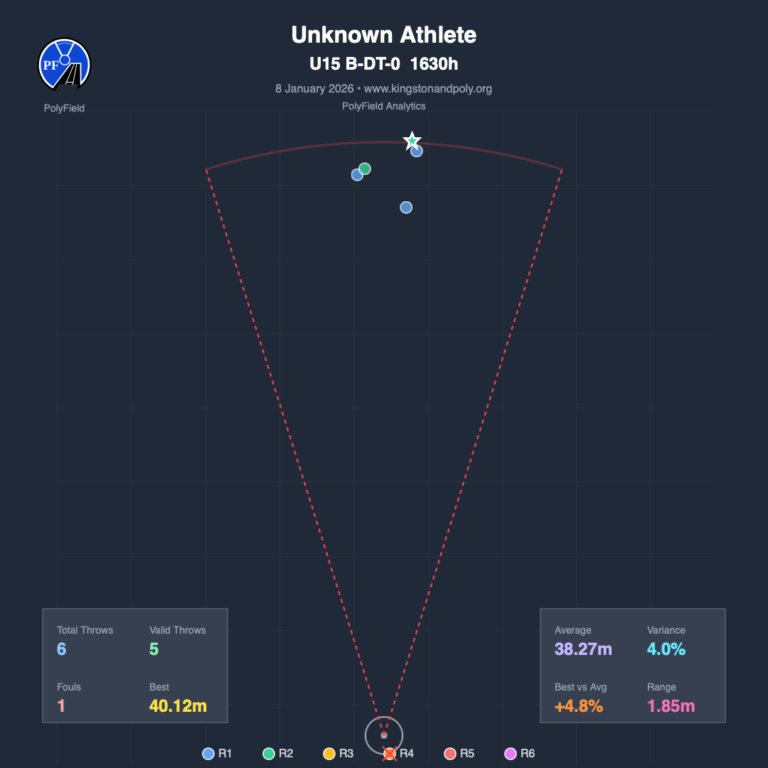
Throw Landings
A bucket based Heat Map detailing per sector the common landing areas.
Useful to inform officials placement in competitions and with collation of data, officials safety too!
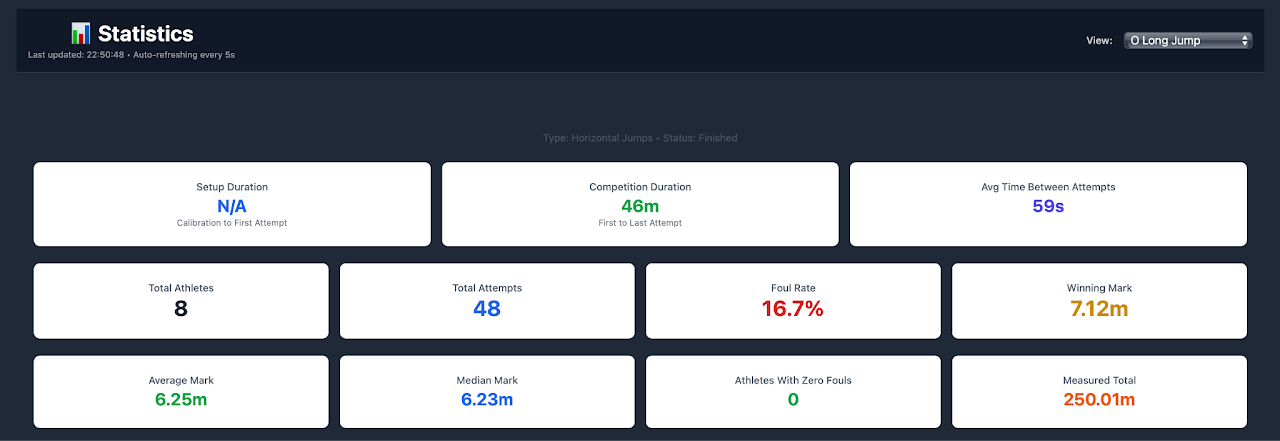
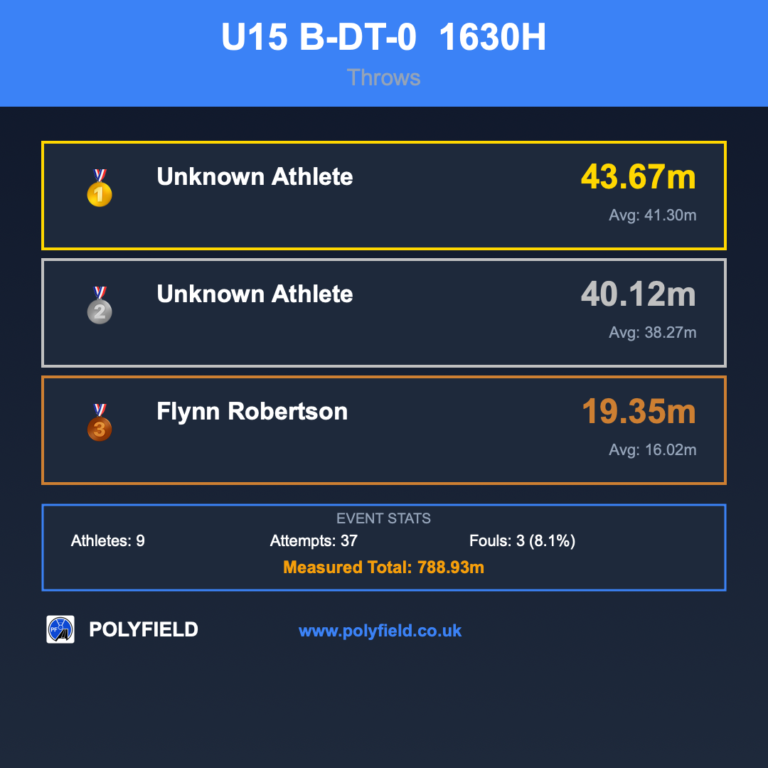
Event Statistics
Setup Time (EDM Calibration start to first attempt)
Competition Duration
Average Time Between Attempts
Total Number of Athletes
Total Number of Valid Attempts
Total Number of Fouls
Winning Mark
Average Mark
Median Mark
Number of Athletes with Zero Fouls
Total of Performances Measured
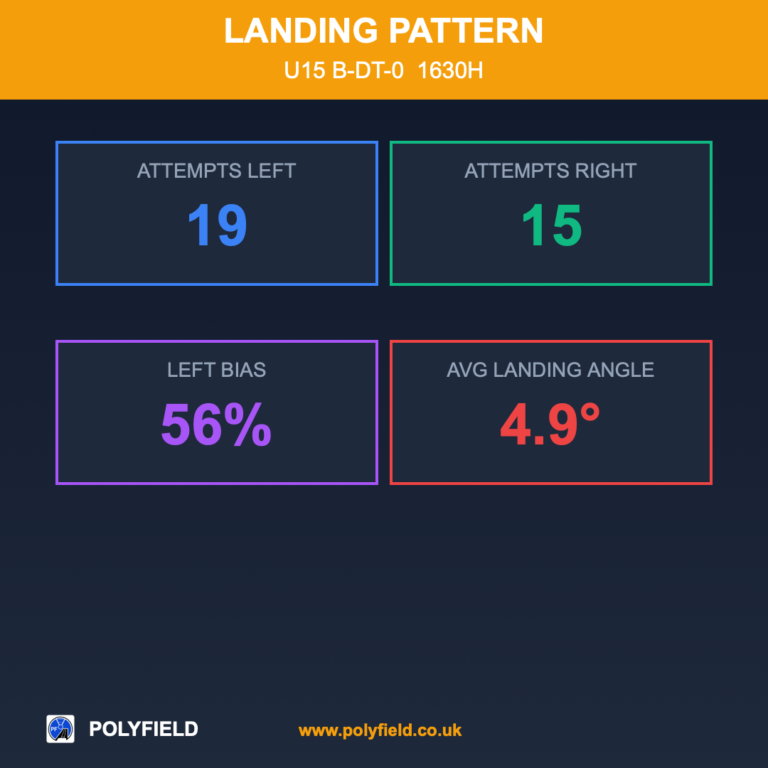
Landing Pattern Statistics (Left / Right split. Average landing angle in sector)
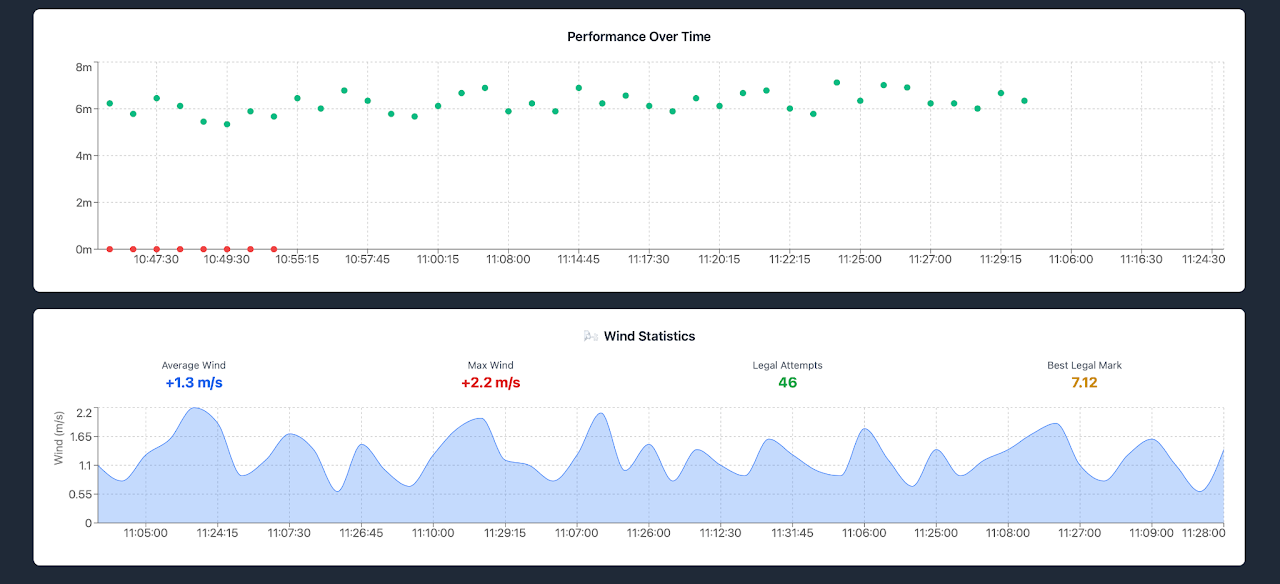
Event Graphs
Graph of Performances over Time
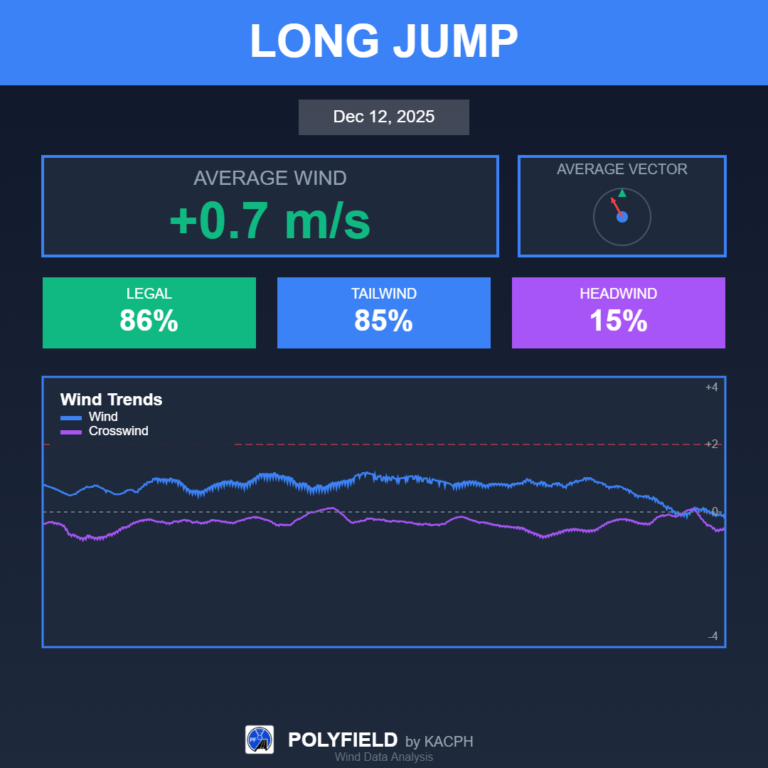
Wind Statistics where a supported Wind Gauge is used
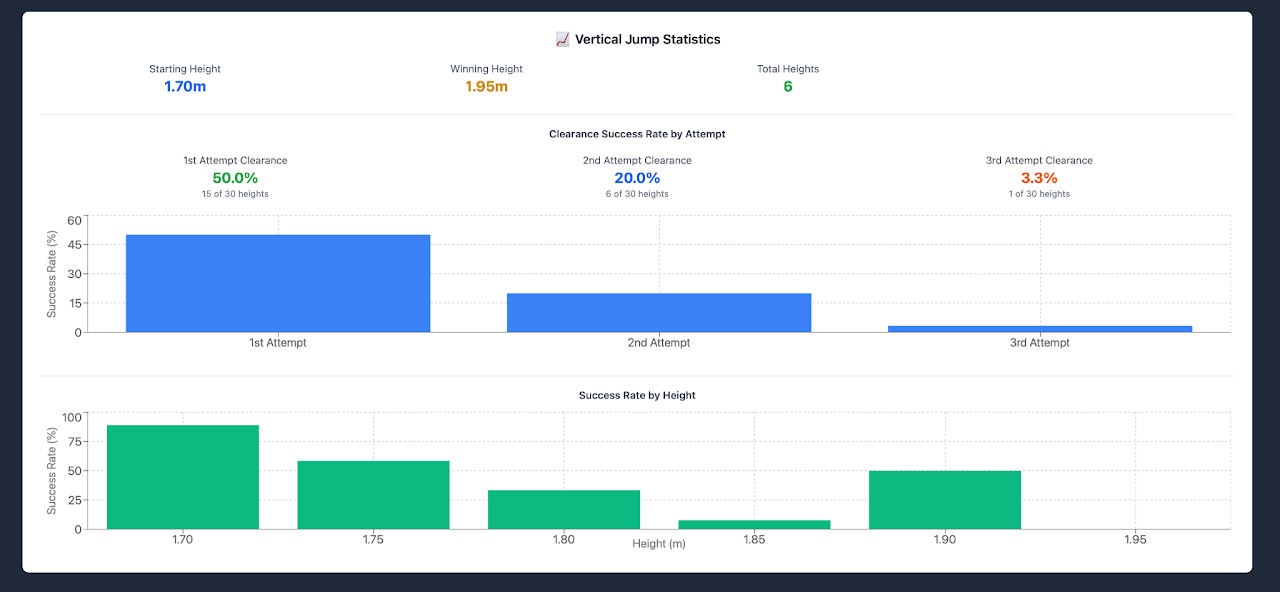
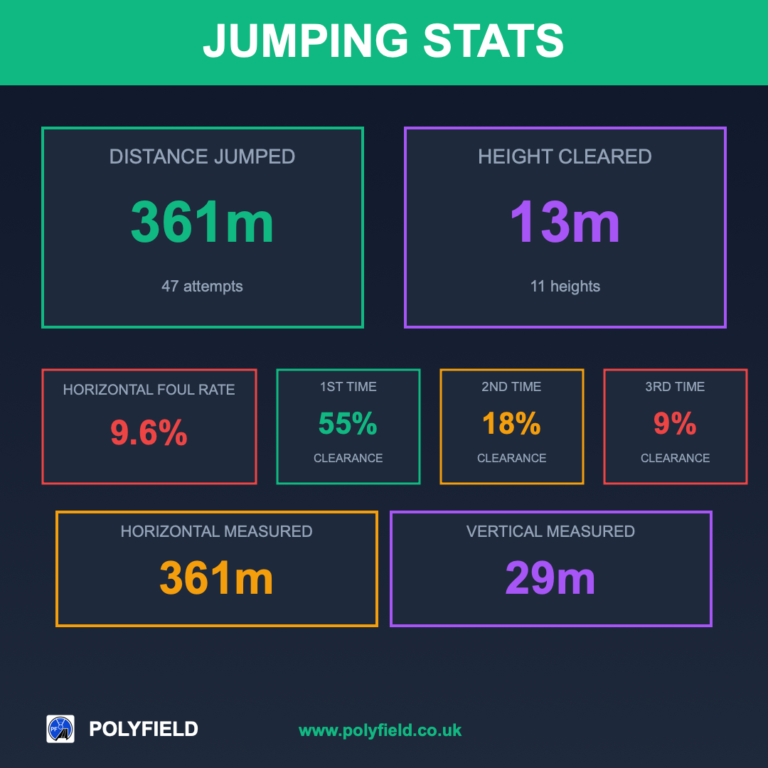
Vertical Jump Analysis
Start Height
Winning Height
Total Number of Heights
Success Rate Per Height
Success Rate Per Attempt (1st, 2nd or 3rd Attempts)
Social Media Exports
Export a PDF Report
All statistics and metrics captured by PolyField Analytics are exportable in a PDF.